Resource – Those things which are useful for us are called resource.
Ex-Wood, School, Railway, Road, school etc
Human resources – The people who make up the workforce of an organization, industry, business sector, or economy is called human resources.
People are a nation’s greatest resource.
It is people with their demands and abilities that turn them into ‘resources’.
Hence, human resource is the ultimate resource.
Healthy, educated and motivated people develop resources as per their requirements.
Human resources like other resources are not equally distributed over the world.
They differ in their educational levels, age and sex.
Their numbers and characteristics also keep changing.
The government of India has a ministry of human resources development, created in 1985 with an aim to improve people skill.
Pradhan Mantri Kaushal VikasYojna (PKVY) was started in 2015 to train one crore Indian Youth from 2016 to 2020 towards employable.
Distribution of Population:
More than 90% of the world’s population lives in 10% of the land surface.
Many more people live in the northern hemisphere than in the southern hemisphere.
60% of the world’s population lives in just 10 countries.
Out of every 100 people in the world:
61 people live in Asia,
12 people live in Europe,
13 people live in Africa,
8 people live in central and South America,
5 people live in northern America and
1 people live in Oceania (Australia, New Zealand and Pacific Islands).
Density of Population – The number of people living in a unit area of the earth’s surface is called density of population.
It is usually expressed as number of persons per square km.
The average population density of the world is 51 persons per square km.
South Central Asia has the highest population density; followed by East and South East Asia.
The population density in India is 382 persons per square km.
Geographical Factors –
Topography
A larger number of people live in the plains than in the mountains or plateaus.
Plains are suitable for farming, manufacturing and most of the other activities.
The Ganges plains are the most densely populated area of the world.
Climate
People prefer to live in moderate climates and avoid extreme climates.
Hence, less number of people lives in the Sahara Desert and in the polar regions of Russia, Canada.
Soil
Fertile plains of the Ganges and Brahmaputra (India), Hwang-he, Chang Jiang (China) and the Nile (Egypt) are the areas with a high population density.
Water
Water is essential for survival of people and hence, more people live in the river valleys than in the deserts.
Minerals
Areas with mineral deposits attract people because of potential of economic development.
Social, Cultural and Economic Factors –
Social
Areas with better housing, education and health facilities are more densely populated.
Pune, Bangalore and Delhi are the cities which attract people because of better facilities.
Cultural
Places with religion or cultural significance always attract people.
Due to this, Varanasi, Jerusalem and Vatican City are densely populated.
Economic
Industrial areas give lot of opportunities to people.
Mumbai’s population grew because of this reason.
In recent years, areas around Delhi have attracted a large number of migrants from across the country; because of industrial development.
Population change:
Until the 1800s, the world’s population grew at a slow and steady pace.
The birth rate and death rate were very high during this period.
There were no proper health facilities. Agricultural production was low and hence food availability was a problem.
The world’s population reached one billion in 1804.
Within 150 years after that, the world’s population reached 3 billion in 1959.
This is usually referred to as the population explosion.
40 years after that, the world’s population doubled and became 6 billon in 1999.
This could happen because of better food supplies, health facilities.
Death rate reduced and birth rate remained fairly high during this period.
Birth Rate: The number of live births per 1,000 people is called birth rate.
Death Rate: The number of deaths per 1,000 people is called death rate.
Note:
When the death rate is more than the birth rate, it will lead to de-growth in population.
When the birth rate is equal to death rate, there will be no growth in population.
When the birth rate is higher than death rate, it will lead to growth in population.
The difference between birth rate and death rate is called natural growth rate of population.
Migration – When people move from one place to another in search of livelihood; it is called migration.
Natural growth rate – The difference between the birth rate and the death rate of a country is called the natural growth rate.
Life Expectancy – The number of years that an average person is expected to live is called life expectancy.
Balance of population:
Migration is another way by which population size changes.
People may move within a country or between countries.
Emigrants are people who leave a country;
Immigrants are those who arrive in a country.
Countries like the United States of America and Australia have gained in-numbers by in-migration or immigration.
Sudan is an example of a country that has experienced a loss in population numbers due to out-migration or emigration.
The general trend of international migrations is from the less developed nations to the more developed nations in search of better employment opportunities.
Within countries large number of people may move from the rural to urban areas in search of employment, education and health facilities.
Immigration – When a person enters a new country, this process is called Immigration.
Emigration – When a person leaves a country. This process is called Emigration.
Patterns of Population Change:
Rates of population growth vary across the world.
The population of the USA and Australia has increased because of immigration.
On the other hand, the population of Sudan has decreased because of emigration.
People from less developed countries usually migrate to the developed countries in search of better employment opportunities.
In case of internal migration, people from rural areas usually migrate to urban areas.
Internal migration does not change the size of the population, but changes the composition of population in a particular area.
Population Composition: The population composition of a country tells about age profile, sex, literacy level, health condition, occupation and income level. Thus, the structure of the population is called population composition.
To understand the role of people as a resource, we need to know more about their qualities.
People vary greatly in their age, sex, literacy level, health condition, occupation and income level.
It is essential to understand these characteristics of the people.
Population composition refers to the structure of the population.
The composition of population helps us to know how many are males or females, which age group they belong to, how educated they are and what type of occupations they are employed in, what their income levels and health conditions are.
Age – sex pyramid – An interesting way of studying the population composition of a country is by looking at the population pyramid, also called an age – sex pyramid.
Population Pyramid – A graphical representation of population composition is called population pyramid.
A population pyramid is a graphical representation of population composition.
In a population pyramid, the total population is divided into various age groups, e.g. 5 to 9 years, 10 to 14 years, etc.
For each age group, the percentage of the total population is subdivided into males and females.
The relative number of children (below 15 years) and that of the elderly (above 65 years) shows the relative number of dependents in the population.
The relative number of people in the working age (between 15 and 65 years) shows the relative number of productive people.
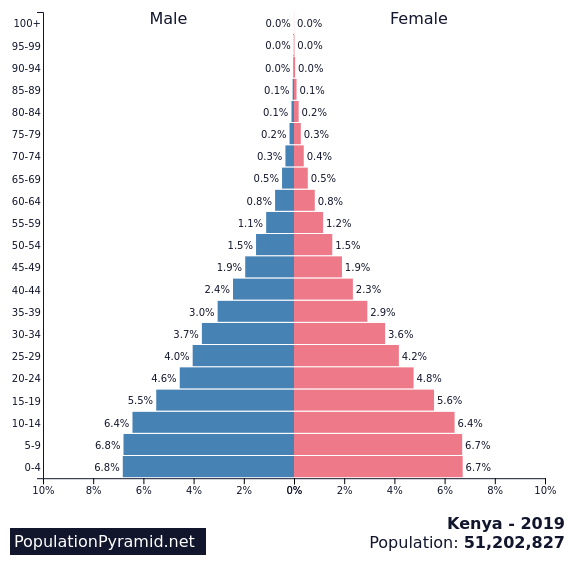
Population Pyramid of Kenya:
The population pyramid of Kenya is very wide at the bottom and very narrow at the top.
This means that while the birth rate is very high; so is the death rate.
A larger proportion of people below 15 years of age show that the relative number of dependents is very high in Kenya.
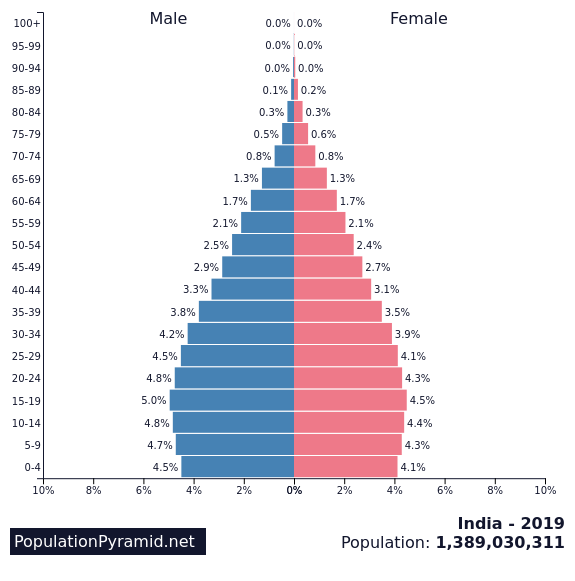
Population Pyramid of India:
The population pyramid of India shows a wider base but the middle portion of the pyramid is in healthy shape.
The top is narrow.
This shows that there is sizeable proportion of people in economically productive age group.
This is a good sign for the economy of India as the number of dependents is not too much.
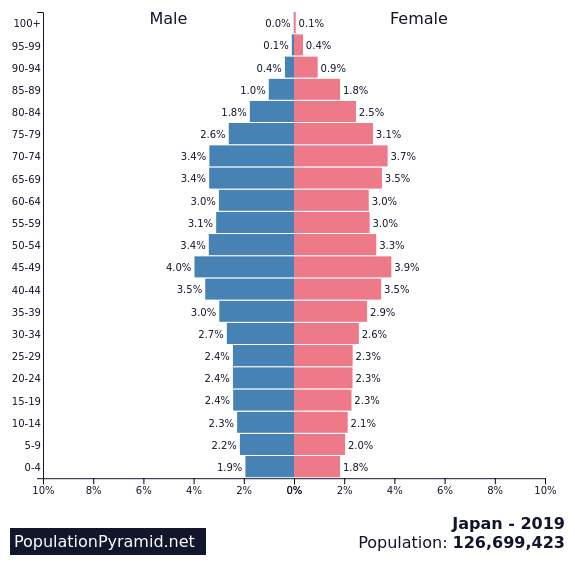
Population Pyramid of Japan:
The population pyramid of Japan shows a wider middle and narrower base and top.
His indicates towards a low birth rate and death rate.
The relative size of dependent population is less compared to the relative size of population in the economically productive age group.
While this is ideal for the present, it does not hold good omen for the future.
In future, there would be more elderly and less people in the working age group.